

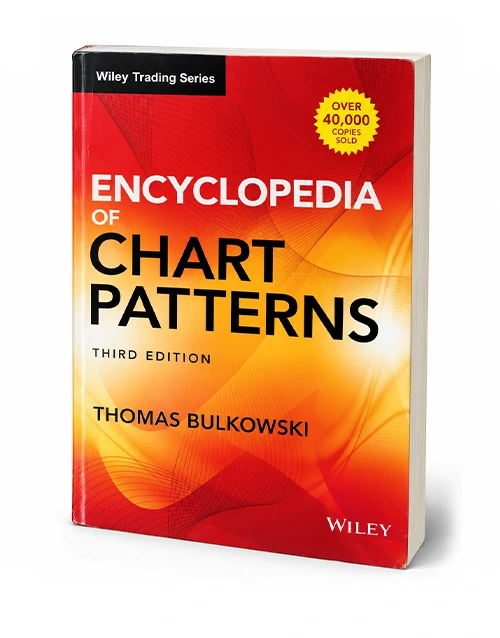


Recognizing a chart pattern is only the first step in technical analysis; understanding how it has performed historically adds another dimension to market research. Encyclopedia of Chart Patterns 3rd Edition Book By Thomas Bulkowski examines price-chart formations through documented market data, pattern identification methods, and statistical analysis. Published by Wiley in the Wiley Trading series, this hardcover reference is intended for readers who want to study the behavior of recurring patterns in financial markets. ISBN 9781119739685 identifies this third edition.
Rather than treating chart formations as automatic signals, Thomas Bulkowski examines how different patterns behave under varying market conditions. The book covers bullish and bearish formations, reversal patterns, continuation patterns, breakouts, and situations in which an expected price move fails to develop. This statistical perspective helps readers investigate the strengths and limitations of technical chart analysis instead of relying solely on visual recognition or traditional trading assumptions.
The third edition discusses a broad range of formations, including head-and-shoulders patterns, double tops and bottoms, triangles, flags, pennants, rectangles, wedges, broadening formations, gaps, and rounding tops and bottoms. It also examines less familiar structures, giving readers a wider vocabulary for interpreting price charts. Each pattern is presented through identification guidance, illustrations, and performance-related information that supports comparison across different formations and market environments.
A distinctive feature of this edition is its emphasis on measurable outcomes. Readers can explore historical failure rates, average price moves, pattern rankings, stop-loss behavior, and the performance of failed or reversed formations. The book also considers how pattern results have changed across market periods. These details provide a framework for asking more precise questions about a trading setup: how often has a formation failed in the examined data, what happened after a breakout, and which characteristics were associated with different outcomes? Historical statistics, however, do not guarantee that a pattern will produce the same result in future markets.
For stock traders, technical analysts, investment researchers, and students of market behavior, Encyclopedia of Chart Patterns, Third Edition can serve as a reference for studying price action and developing a more evidence-based approach to chart interpretation. Readers with experience in technical analysis may use it to compare familiar formations, while newer learners can consult its visual examples and identification guidelines to understand how patterns are distinguished. The statistical material can also support independent research and the evaluation of trading hypotheses.
Thomas Bulkowski brings extensive experience in stock-market analysis to this reference, combining practical observations with systematic examination of chart formations. The book is most useful when approached as a research resource rather than a collection of guaranteed trading signals. Market conditions, transaction costs, risk management, and individual decision-making remain important when interpreting historical findings.
If you are looking for Encyclopedia of Chart Patterns 3rd Edition (9781119739685), this Wiley hardcover brings together dozens of chart formations, visual identification guidance, and statistical comparisons in one substantial reference. It is suited to readers who want to investigate how technical patterns have behaved historically and use that information to inform their own market analysis. Check the product details to confirm the edition, hardcover format, and ISBN before ordering.
There are no reviews yet.